Background and Challenges
Portfolio analytics is an important process of the investment cycle. The process today typically includes performance measurement, performance attribution, portfolio risk analysis and recently back-testing of investment strategy (due to expansion of the middle office duties). Asset owners, consultants and asset managers often rely on one or multiple analytics systems to perform these tasks.
I, as an investment analyst, have personally been an user of some of the popular analytics systems for many years. I have often wished for an visual analytics tool that would support fast prototyping and reusable analytics workflow. In currently available system software design, the setup of systems and troubleshooting of both raw and derived data is rather cumbersome and requires significant effort from the user. I believe however that the user of such an analytics system, should focus more on the analysis itself and spend significantly less time on system configurations; including often finding out the location of a hidden setting button to trigger a layered calculation. Any analytics software is complex by design, however a more user friendly software design can significantly increase the user productivity.
According to the recent industry trends, a typical analytics team is handling increasingly more requests from the stakeholders, and even more so in turbulent times. Therefore performing a timely and in-depth portfolio analysis is increasingly more challenging in analytical function today in particular due to multiple increments (i.e. from monthly to daily to intraday data) and diversity of the portfolio data (e.g. multiple asset class from multiple strategies); not to mention the increased importance of maintaining the same level of accuracy and quality of the analysis. Even though, integrity of the upstream data systems is an important pre-condition for an effective analytics, software level solutions can bring huge benefits to the analytics function.
My design of an analytics system incorporated the following properties to overcome these challenges:
- Transparency in the flow of intermediate data, i.e. intermediate data are accessible and auditable in the entire analytics workflow.
- Replicable system derived analytics results, e.g. weighted-average duration is a derived value programmed within the system, it can be replicated and traced within the system using the raw data inputs which is durations and weights.
- Generalized analytics calculation. E.g. weighted-average return and weighted-average duration are mathematically using the same formula. A generalized calculation module can be designed to cover both.
- Visibility of overridden operations and settings within the system. There can be plenty of analytics data sources for same metric. E.g. duration information of a bond can be missed in one source, but covered in another source. Aggregation of two sources have to be a visible process to the user.
Component-based Design
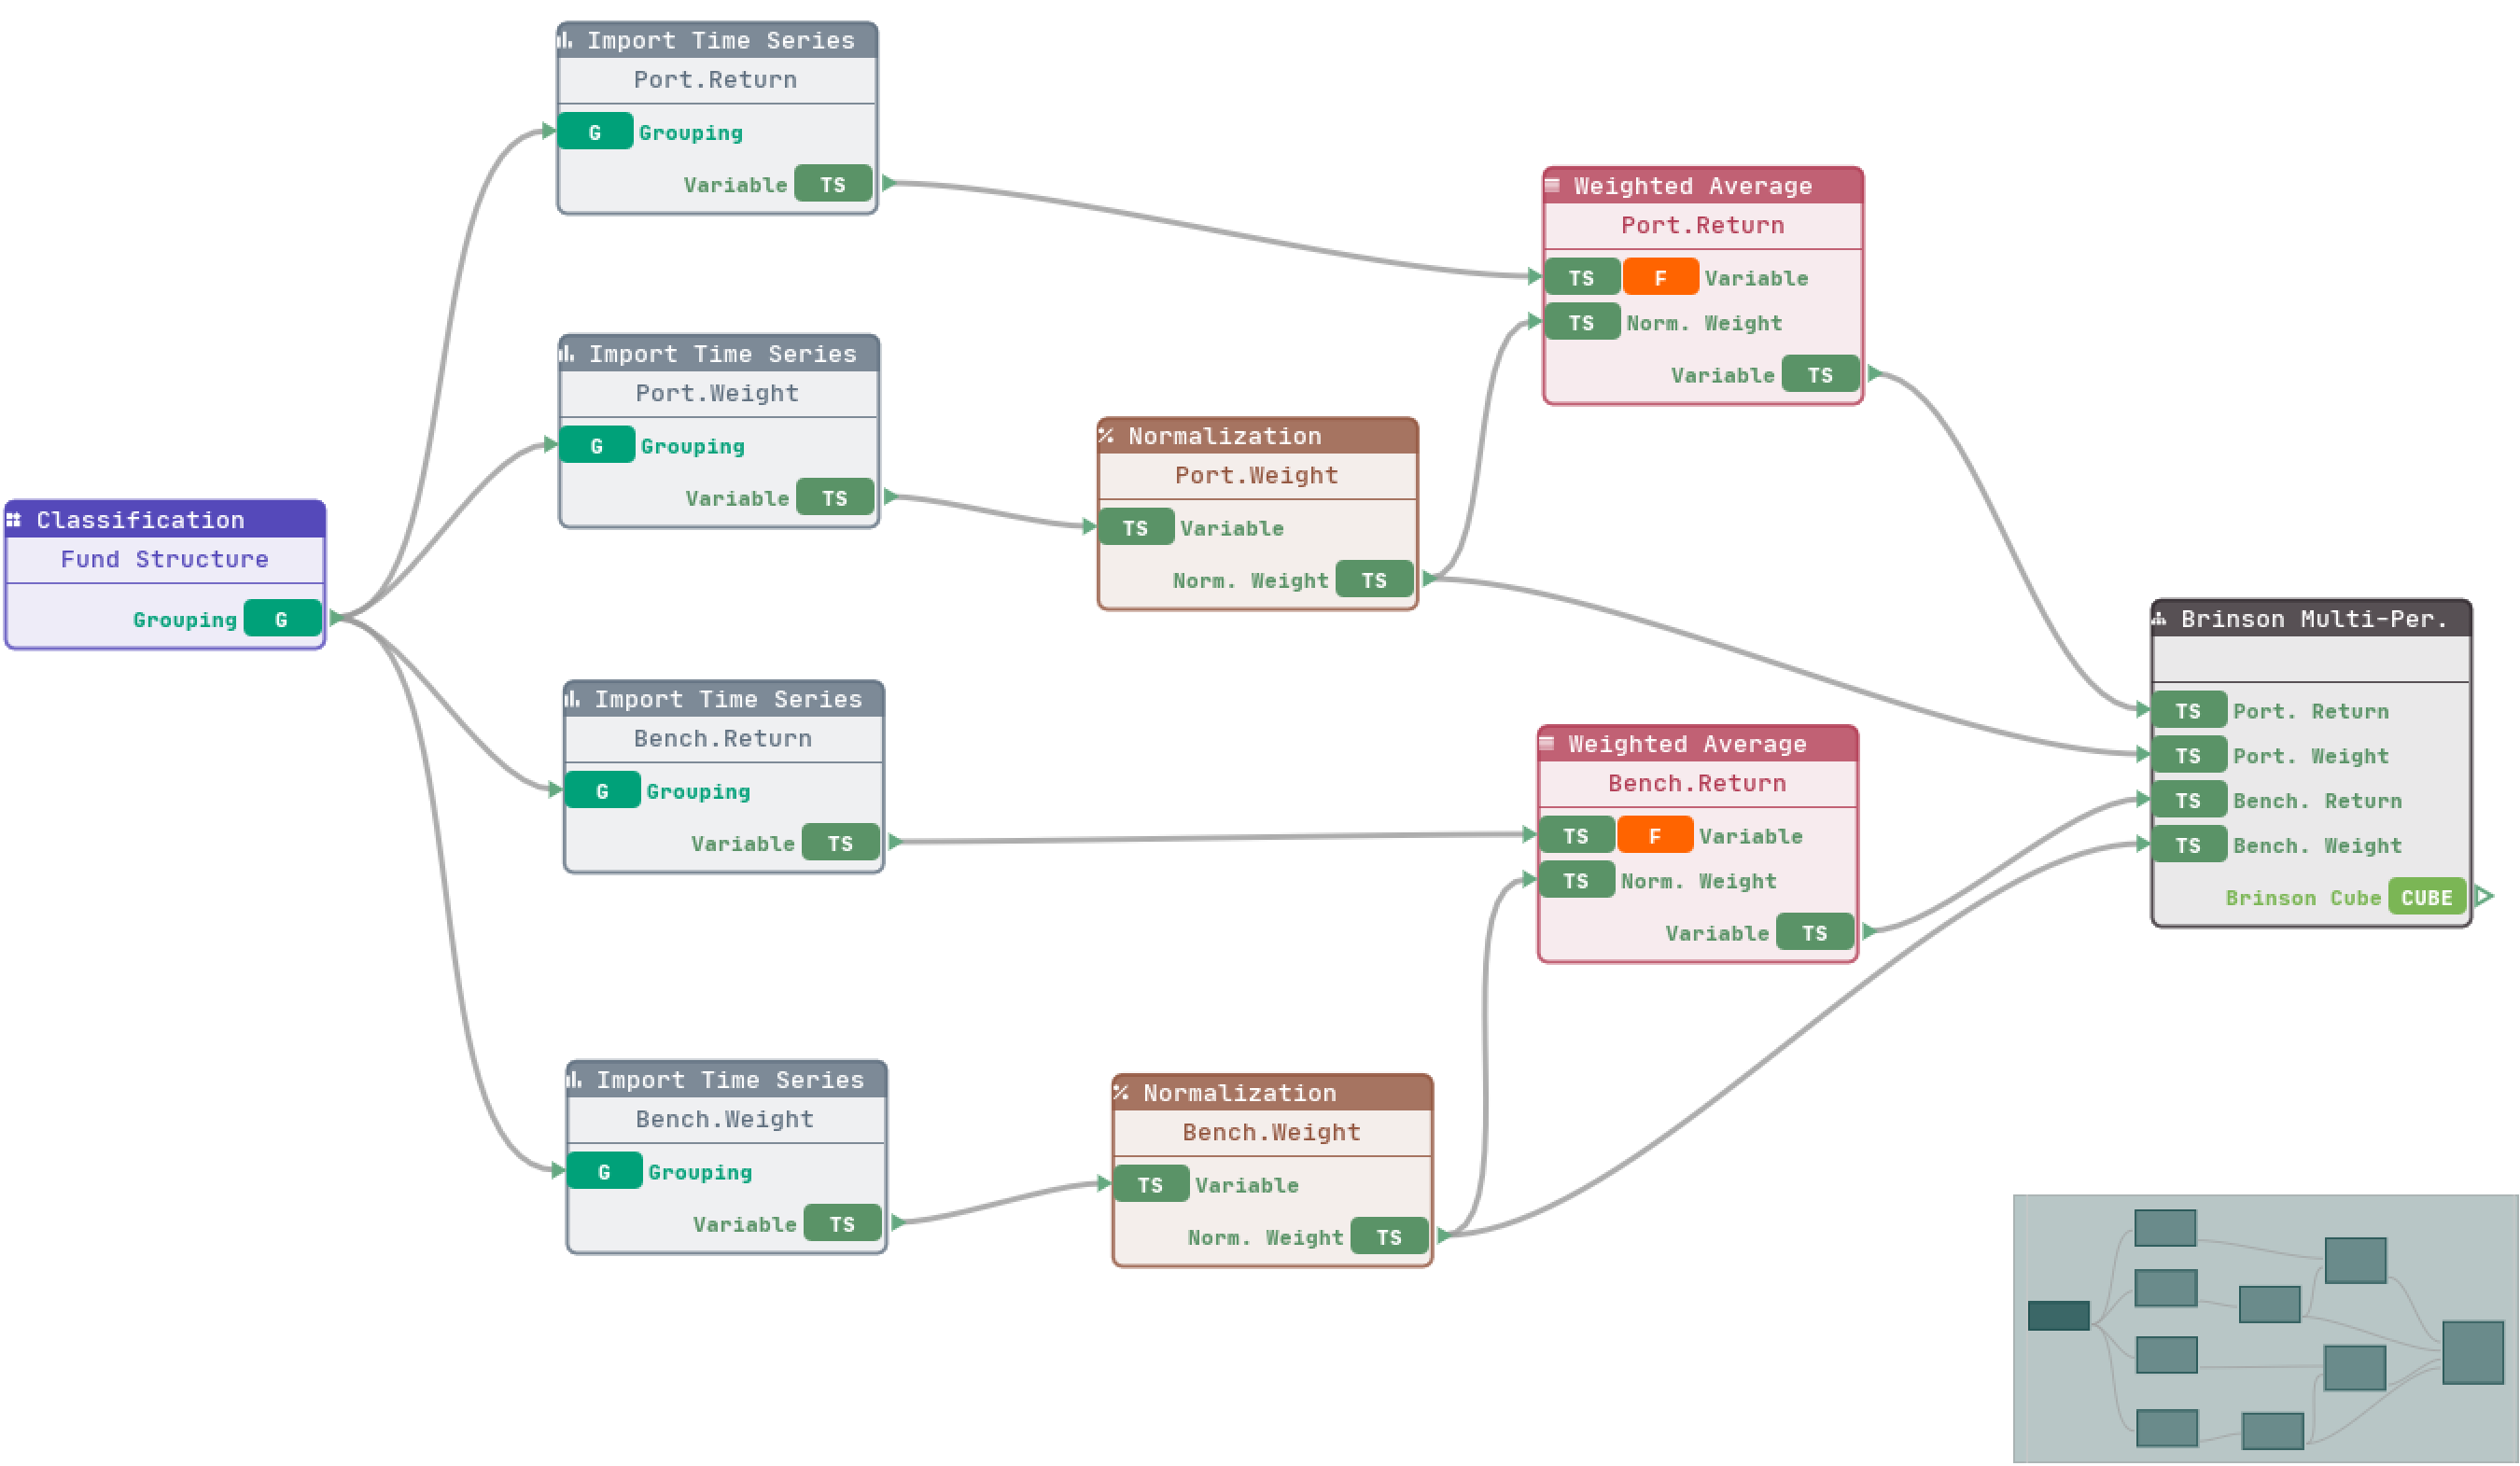
VisQuant is designed to overcome such challenges. The application employs a node based editor which is commonly used in gaming industry to visually program 3D graphic effects. Node editor brings interactive data analysis feature to portfolio analytics area.
The component widget is a minimal structure in VisQuant. A component widget accepts one or more inputs, those inputs are processed and the results are consolidated into an analytics output. The output is a data structure that can flow to next component widget as its inputs. As such, many common mathematical models for portfolio analytics can be decoupled into granular component widgets that handle similar, key and independent computations.
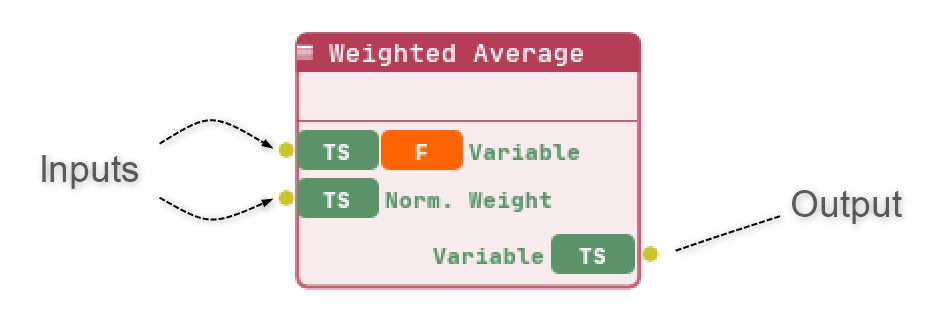
In VisQuant’s architecture, common analytics functionalities, such as weighted average and normalization are designed as component widgets. A component widget in node editor can have a window expanded to granular setups of a certain analytics calculation. An example of an opened window from the component widget Weighted Average is shown below:
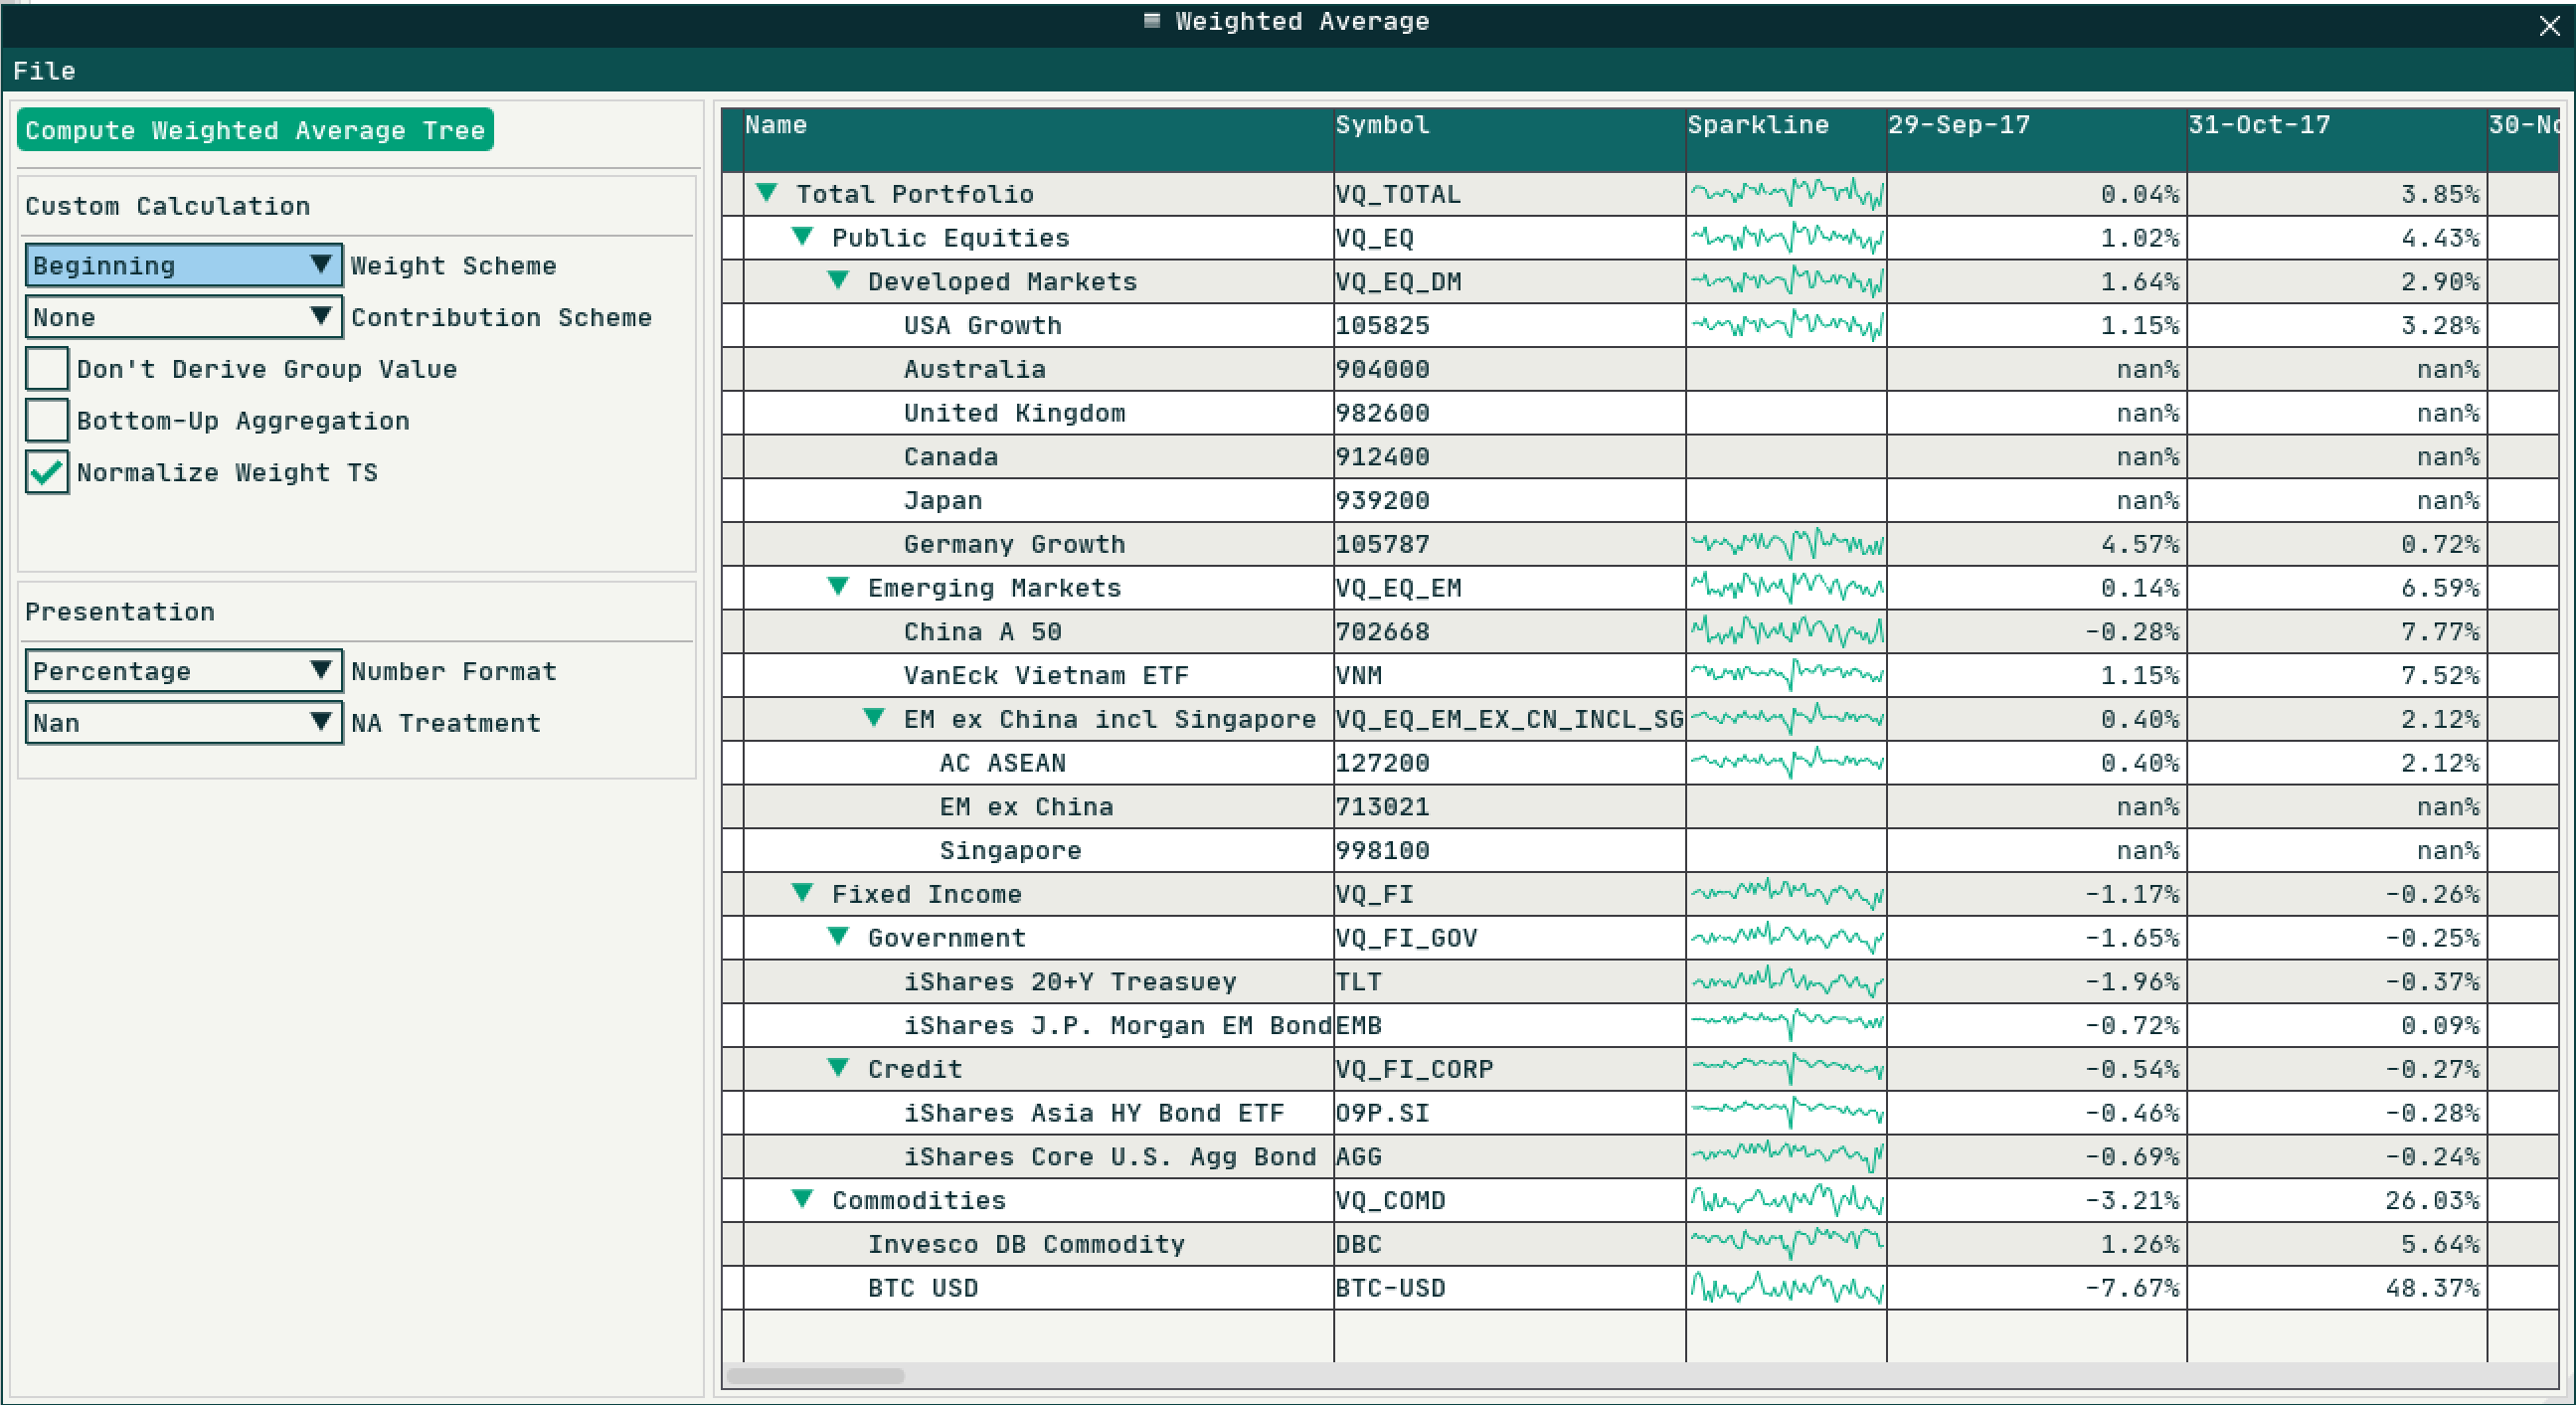
Common computations can be generalized into a single module in component-based design. Consider weighted average performance and portfolio effective duration. We can compute both measures using Weighted Average widget. It is because the underlying mathematical framework remains the same, i.e. weighted arithmetic mean:
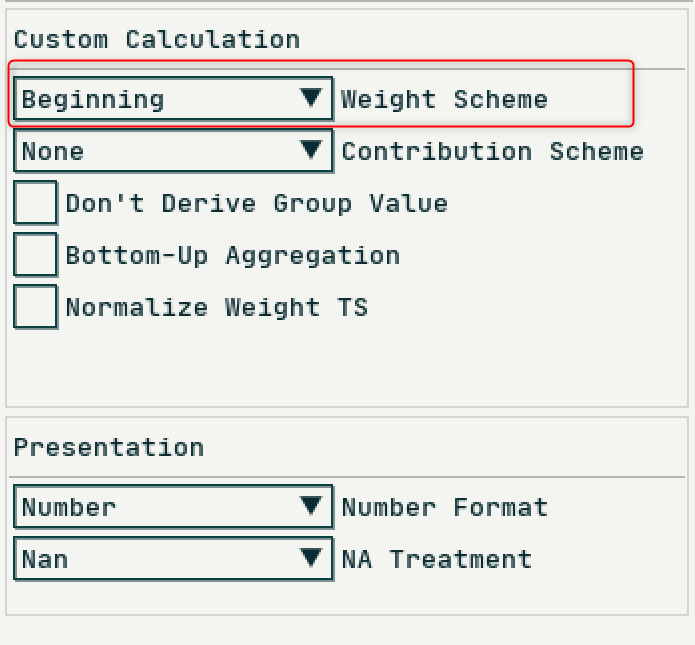
In the above formula, denotes normalized beginning weight under the context of portfolio return aggregation, denotes segment or security return data, denotes the weighted average performance. If the context is to calculate portfolio effective duration, is supplied with security effective duration information, but weight is ending weight of a security since end of day duration risk exposure is desired. The option to use whether beginning or ending weights is implemented within Weighted Average setup window as a common setting in portfolio analytics toolbox. Whether using beginning weight or ending weight for calculation, VisQuant gives user full flexibility to adapt their own definitions in different contexts:
Reusability for Efficiency
Multiple component widgets are glued together to achieve a certain task to fuse an analytics workflow (i.e. DAG - A directed acyclic graph).
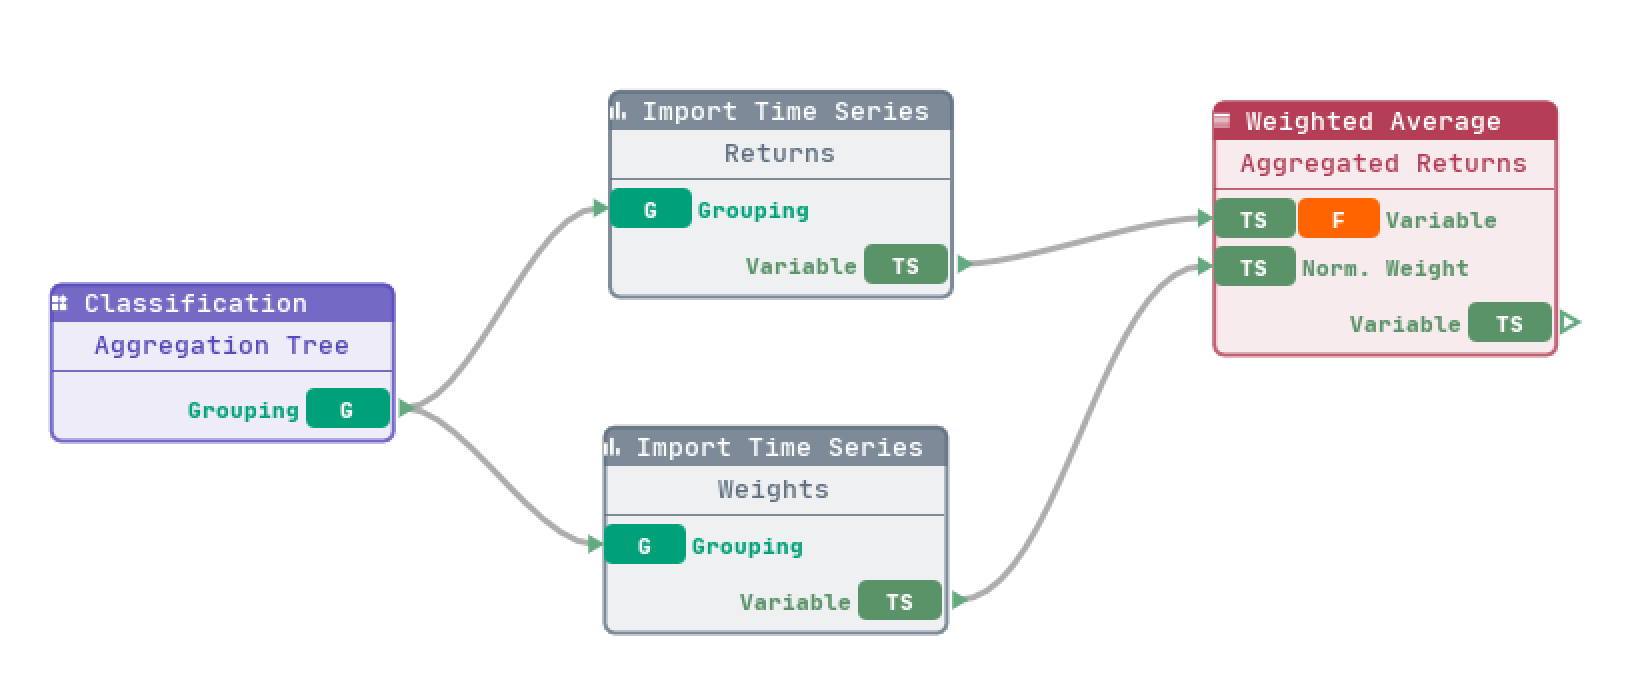
The DAG paradigm ensures that there will be no circular calculation within a workflow; it guarantees that upstream input/output data remain unchanged if downstream widget settings are changed and require recalculation. The architecture brings two advantages to the analytics process:
- No repetitive calculations. Computations are only being triggered for those widgets that need to be updated.
- Easy to troubleshoot data issues. Inputs and outputs data can be easily inspected.
For productivity improvement, the workflow can be saved and stored for future use or as a reference for similar tasks.
Feedback
That was a brief introduction of VisQuant. I plan to provide more updates on functionalities and improvements in future posts. Meanwhile, I invite you to submit your recommendations or feedbacks through the VisQuant Public.
